Full CAC in B2B SaaS: Why €1,500 in Ads Can Mean €5,000 per Customer
Calculate fully loaded customer acquisition cost, model CAC payback and see why ad-platform CAC can understate what B2B SaaS growth really costs.
Full CAC includes acquisition costs beyond ad spend
Fully loaded CAC is the sales and marketing cost attributable to acquiring new customers, divided by the number of new customers won in the matching cohort. Depending on the company’s accounting policy, this can include paid media, sales salaries and commissions, marketing payroll, and acquisition tools. Keep the scope consistent and exclude costs for serving existing customers unless your chosen metric explicitly includes them.
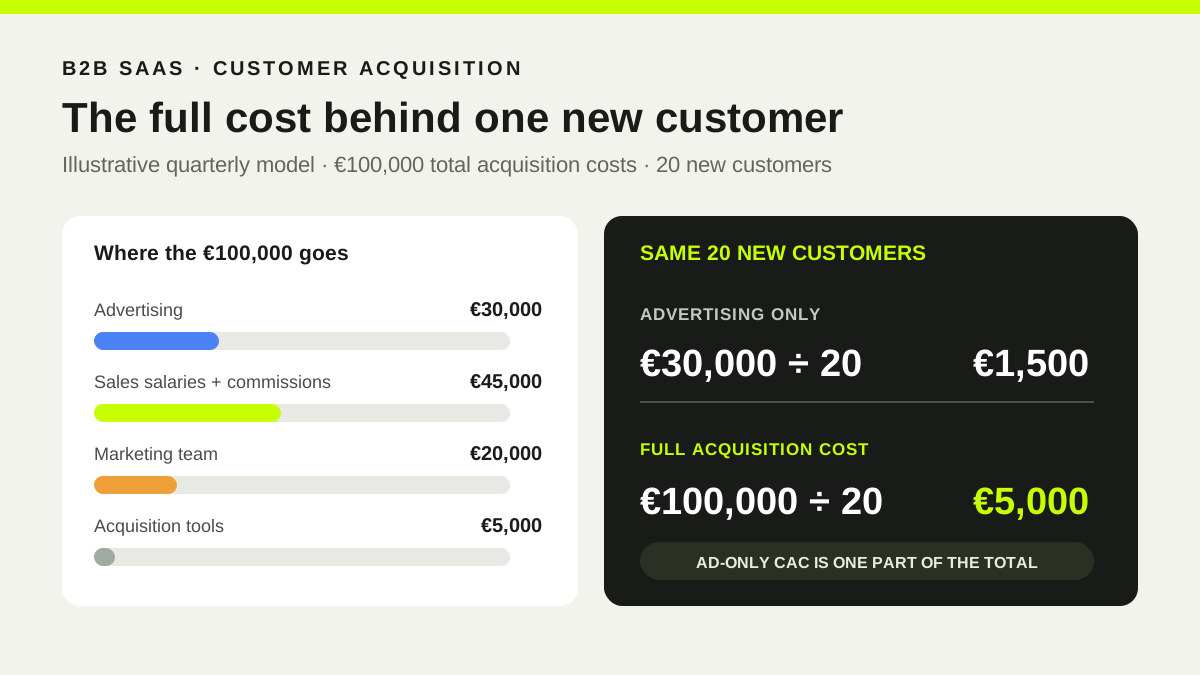
In this illustrative quarterly model, €30,000 goes to advertising, €45,000 to sales salaries and commissions, €20,000 to the marketing team and €5,000 to tools. The €100,000 total is divided by 20 new customers: full CAC is €5,000. Ad spend alone divided by the same 20 customers gives €1,500. The ad-only figure is useful for campaign analysis, but it does not describe the company’s full acquisition cost.
| Cost or calculation | Amount |
|---|---|
| Advertising | €30,000 |
| Sales salaries and commissions | €45,000 |
| Marketing team | €20,000 |
| Acquisition tools | €5,000 |
| Total acquisition costs | €100,000 |
| New customers won | 20 |
| Ad-only CAC (€30,000 ÷ 20) | €1,500 |
| Full CAC (€100,000 ÷ 20) | €5,000 |
CAC payback estimates how long acquisition takes to repay
CAC payback is the time it takes a new customer’s gross profit to cover the cost of acquiring that customer. A simple monthly estimate is: full CAC ÷ (new customer MRR × gross margin). With €5,000 full CAC, €500 MRR and 80% gross margin, monthly gross profit is €400 and estimated payback is 12.5 months.
This estimate assumes recurring revenue and gross margin stay constant. If the customer leaves after eight months, the account has generated €3,200 in gross profit, leaving €1,800 of CAC unrecovered before financing and other costs. A cohort model should account for churn, expansion, discounts, onboarding treatment and the timing of cash collection.
SaaS CAC payback benchmarks depend on contract value
Benchmarkit’s 2025 B2B SaaS Performance Metrics report shows median CAC payback of 16 months for 2022, 14 months for 2023 and 18 months for 2024 in the reporting subset. That is a 12.5% increase from 2022 to 2024. The report says 148 respondents reported CAC payback out of 583 survey participants. It also cautions that payback is strongly correlated with annual contract value (ACV).
The often-repeated 12-month target is a rule of thumb, not a universal pass/fail line. Compare a company with businesses of similar ACV, go-to-market motion, gross margin and funding model, and check whether the business can finance the time to payback.
Benchmarkit — 2025 B2B SaaS Performance Metrics
More ad budget cannot fix a constrained sales process
Imagine increasing marketing budget by 50%. Lead volume rises, but the sales team cannot respond quickly or qualify every opportunity. First contact is delayed, the sales cycle gets longer and the SQL-to-Closed-Won rate falls. Spend can then grow faster than new-customer revenue.
The bottleneck may sit in sales capacity, lead quality, targeting or handoff—not in the media channel. Track marginal CAC, the cost of each additional customer as spend grows. Average CAC can still look acceptable while the next budget increase produces customers at a much higher cost.
Metrics CEOs and CFOs can use to assess growth
Review acquisition economics by channel, customer segment and acquisition cohort. A practical dashboard can include: fully loaded and paid-media CAC; CAC payback; qualified-lead share and pipeline conversion; gross revenue retention (GRR) and net revenue retention (NRR); LTV-to-CAC with its assumptions; and realised revenue and gross profit by acquisition cohort.
Use channel CAC for directional comparison only when costs can be attributed consistently. For long sales cycles, align spend and customers by cohort rather than dividing one quarter’s spend by customers who happened to close in that quarter.
What is likely to matter more in 2027–2028
Our outlook is that more SaaS teams will connect marketing budgets to revenue quality, payback time and retention. Companies that join advertising, CRM and finance data will be better placed to see which campaigns create qualified pipeline and durable customers—and where another euro of spend starts to weaken unit economics. This is a strategic outlook, not a published market forecast.
How AdsWaves helps B2B SaaS teams assess CAC
With 15 years in performance marketing, AdsWaves looks beyond the amount shown in an advertising account. For B2B SaaS, we connect media spend with the customer journey, qualified pipeline and won deals, then identify the assumptions needed to estimate channel economics.
If you know your CPL but cannot confidently estimate full CAC payback by channel, start by reconciling campaign, CRM and finance data before increasing the advertising budget.
What is the difference between paid CAC and full CAC?
Paid CAC divides paid-media spend by customers attributed to that media. Full CAC includes the sales and marketing costs assigned to acquiring new customers. They answer different questions: paid CAC helps assess media performance; full CAC helps assess the acquisition model. Neither is reliable if the cost scope, attribution or customer cohort is inconsistent.
Which costs should be included in B2B SaaS CAC?
Set a written, consistent rule. A fully loaded acquisition view commonly includes paid media, acquisition-related sales compensation and commissions, marketing payroll, and sales and marketing tools. Separate customer success, support and onboarding costs if they relate to serving customers rather than acquiring them; accounting treatment can differ by business and metric.
What is a good CAC payback period for SaaS?
There is no single target for every SaaS company. CAC payback varies with ACV, gross margin, sales motion, retention and access to cash. Use comparable companies as context, then set a limit that fits your own margin, growth plan and ability to fund acquisition until customers repay CAC.